
Another busy few weeks in Right Revenue HQ!
This month's release includes two new reports and a brand new dashboard, giving you even greater insight into your booking patterns, lead times and pricing strategy, alongside some little improvements that many of you have asked for.
As always, our goal is to give you the information you need to make better commercial decisions, without spending hours analysing data.
Here's what's new…
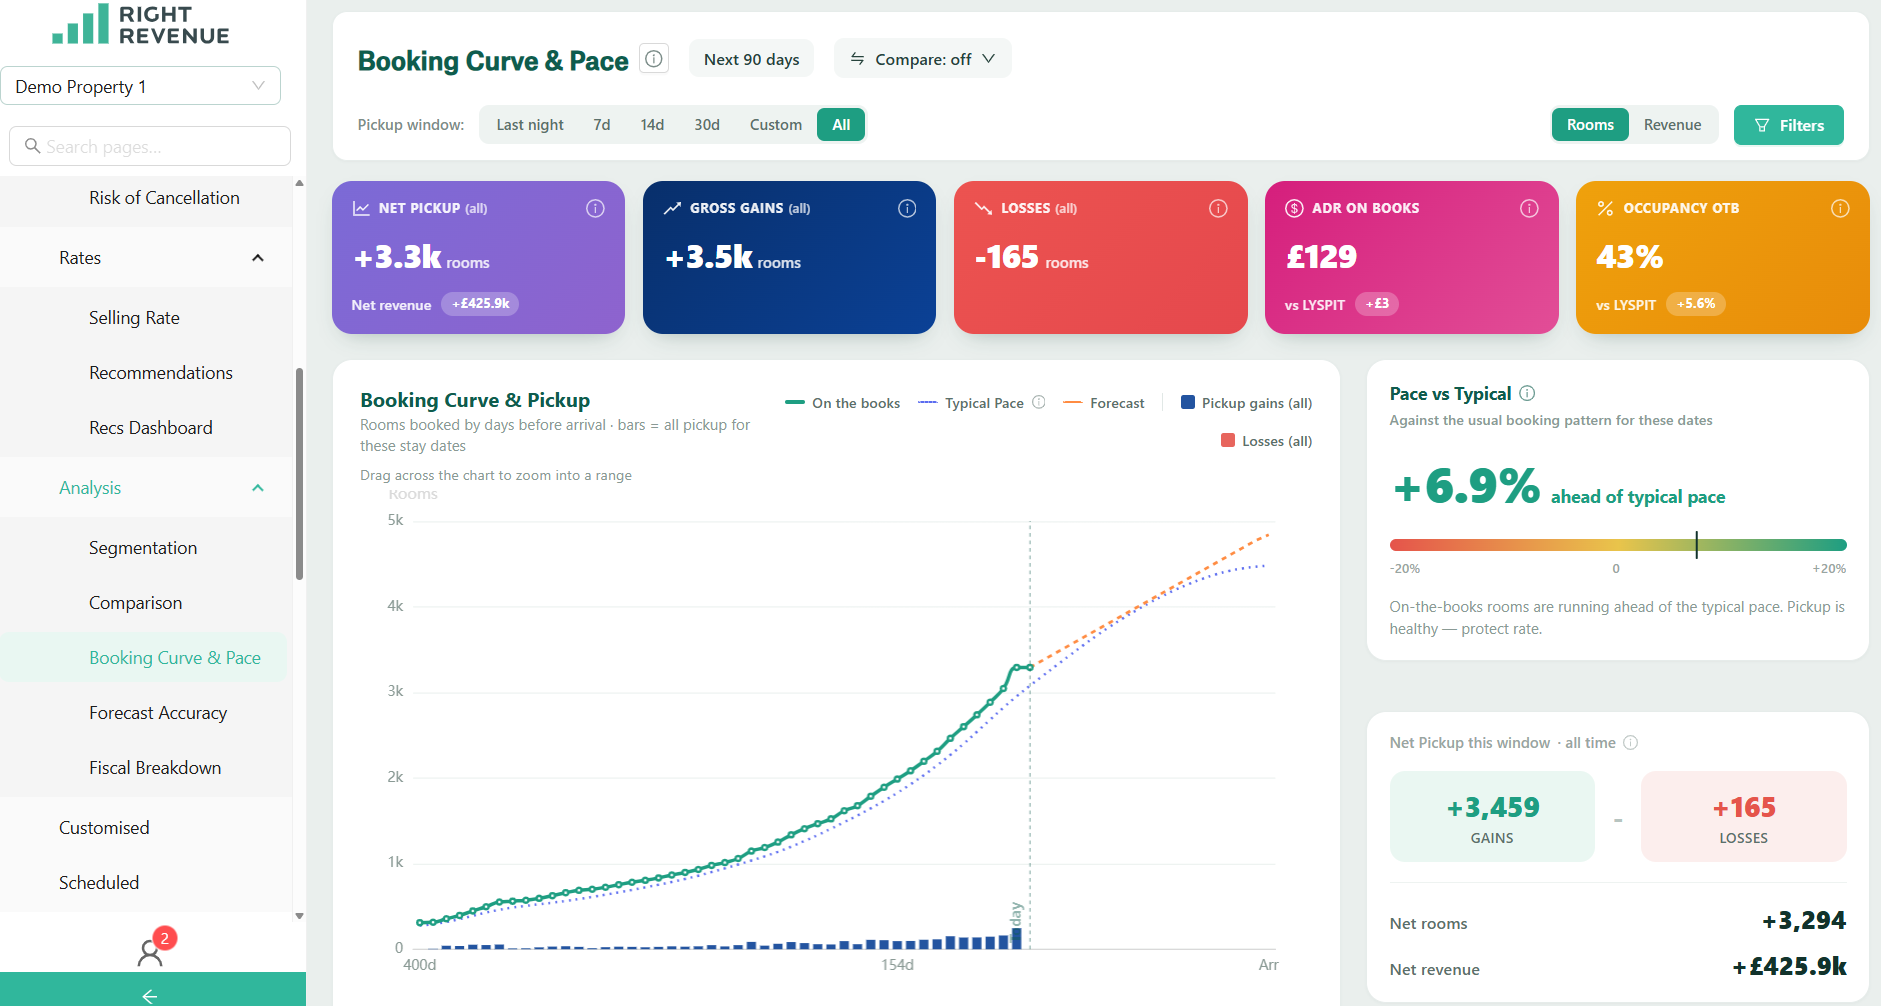
NEW: Booking Curve & Pace Report
Is your business pacing as you would expect?
Why we developed it
Our new Booking Curve & Pace Report maps your actual pick-up against your typical booking pace, so you can see at a glance where your business is ahead, behind or performing as expected. Perhaps you need to work with your marketing team on a special offer to fill some quieter dates? Or perhaps business is pacing ahead and it's time to review your pricing or the behaviour of certain segments?
Where to find it Reports / Analysis / Booking Curve & Pace
How to use it
Start by taking the tour using the little information icon beside the report name at the top left of the page.
Select the future dates you wish to review. The report defaults to the next 90 days.
Adjust the pick-up window you want to analyse, whether that's last night, the last seven days, 14 days or longer.
Choose to review performance by rooms or revenue. Your selections will be reflected in the coloured tiles at the top of the report.
Filter by segment, source, channel, rate type or room type using the Filters icon at the top right. You can choose to view your applied filters as a total or separately.
View your booking pace against typical pace, alongside the net change in gains and losses.
Explore gains and losses by segment, changes in your on-the-books business over time and the impact of lead time.
What we think you'll love
The detailed insights give you a natural-language overview of your performance.
And the magic really happens in the main graph! Spend some time exploring it and you'll find a wealth of information to help you understand how your business is performing and where action might be needed.
NEW: Recommendation Dashboard
How are you interacting with your rate recommendations?
Why we developed it
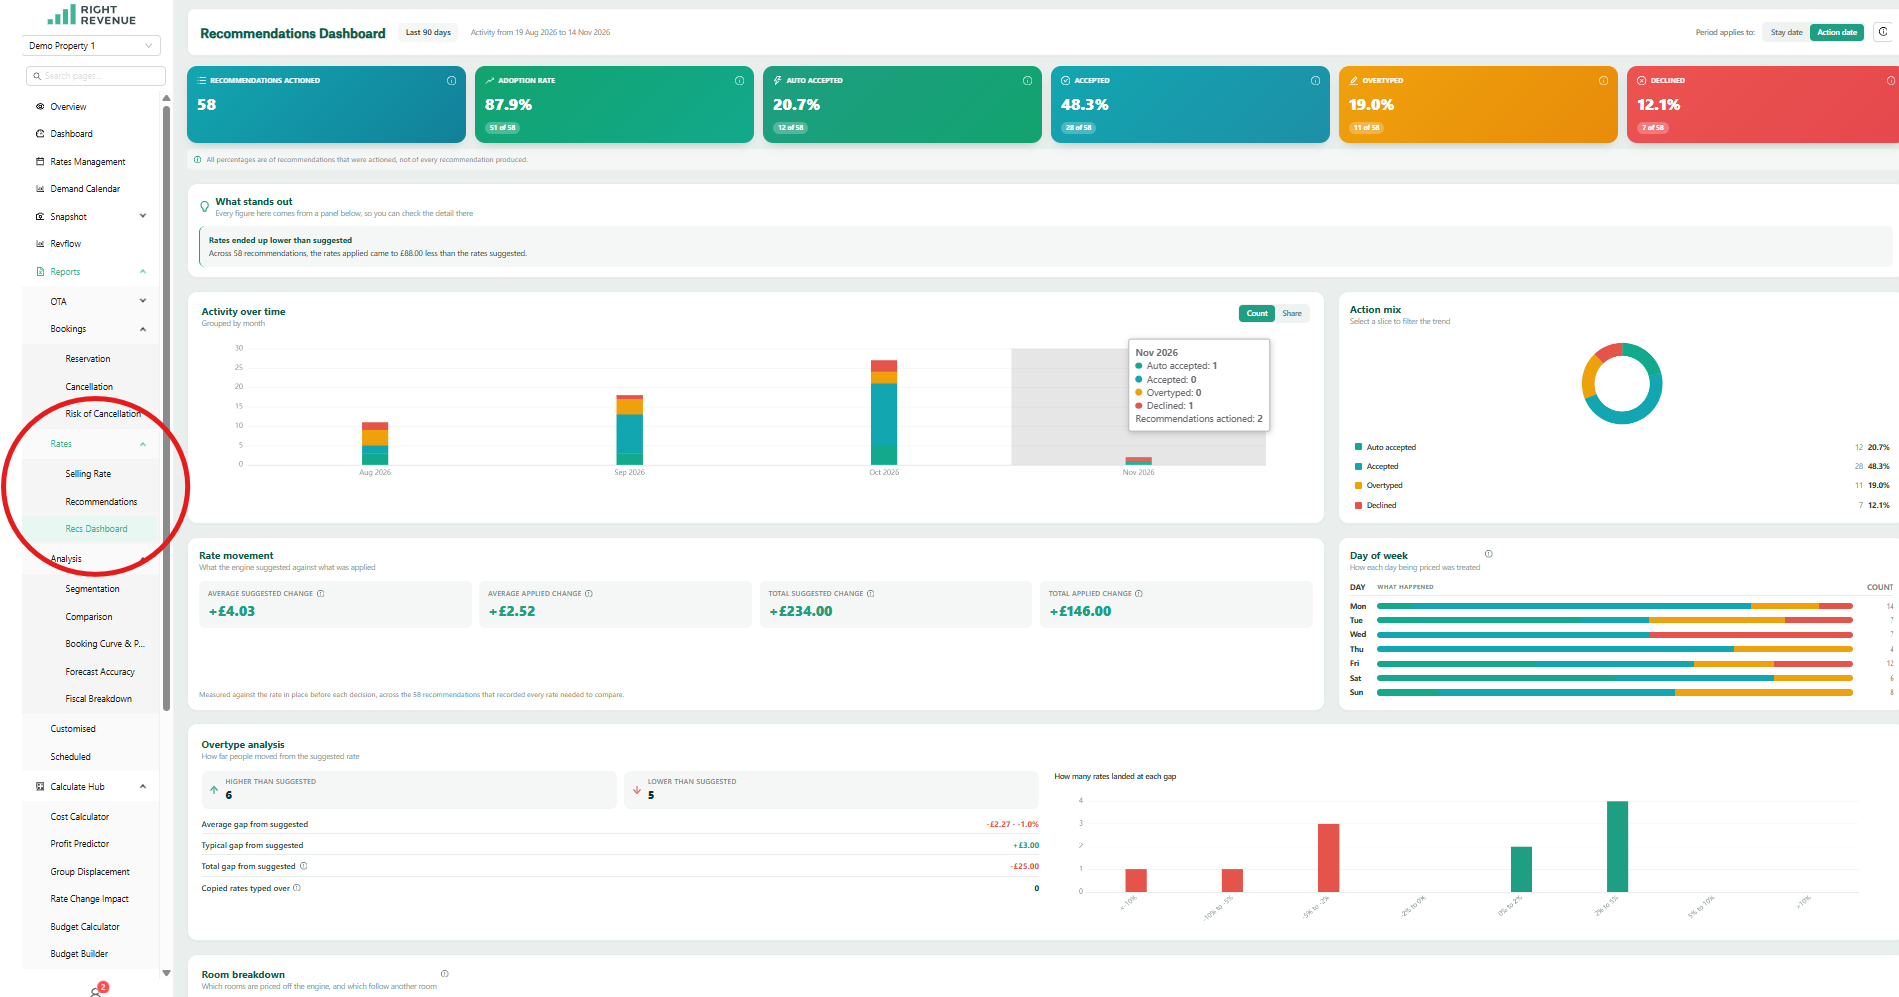
We believe in being completely transparent about the recommendations we make and how they are being used by your team.
Our new Recommendation Dashboard gives both you and the Right Revenue team greater visibility of your pricing strategy, how you are interacting with our rate recommendations and their impact on your business.
For example, if you are regularly overriding our rate recommendations, perhaps we need to look together at your Hurdle and Rack settings or review your segmentation behaviour.
Where to find it: Reports / Rates / Rec's Dashboard (Or simply use the handy search bar on the left-hand navigation.)
How to use it
Start by taking the tour to familiarise yourself with the new dashboard.
Select the dates you wish to review. The dashboard defaults to the last 90 days.
Use the coloured tiles to see how many recommendations your team has interacted with, your adoption rate and how you have responded to those recommendations.
Explore the detailed insights into who is interacting with recommendations, when, where and how.
One little point to note: the dashboard does not show the total number of recommendations made, as we continue to make recommendations each day if you haven't interacted with them.
We would therefore encourage you to interact with as many recommendations as possible to help us build a clearer picture of how your pricing strategy is performing.
What we think you'll love
Alongside the figures, we've included natural-language insights to help you understand how your team is interacting with our recommendations.
We see this report as a great opportunity to work together, understand the impact of our recommendations and identify where improvements could be made on either side.
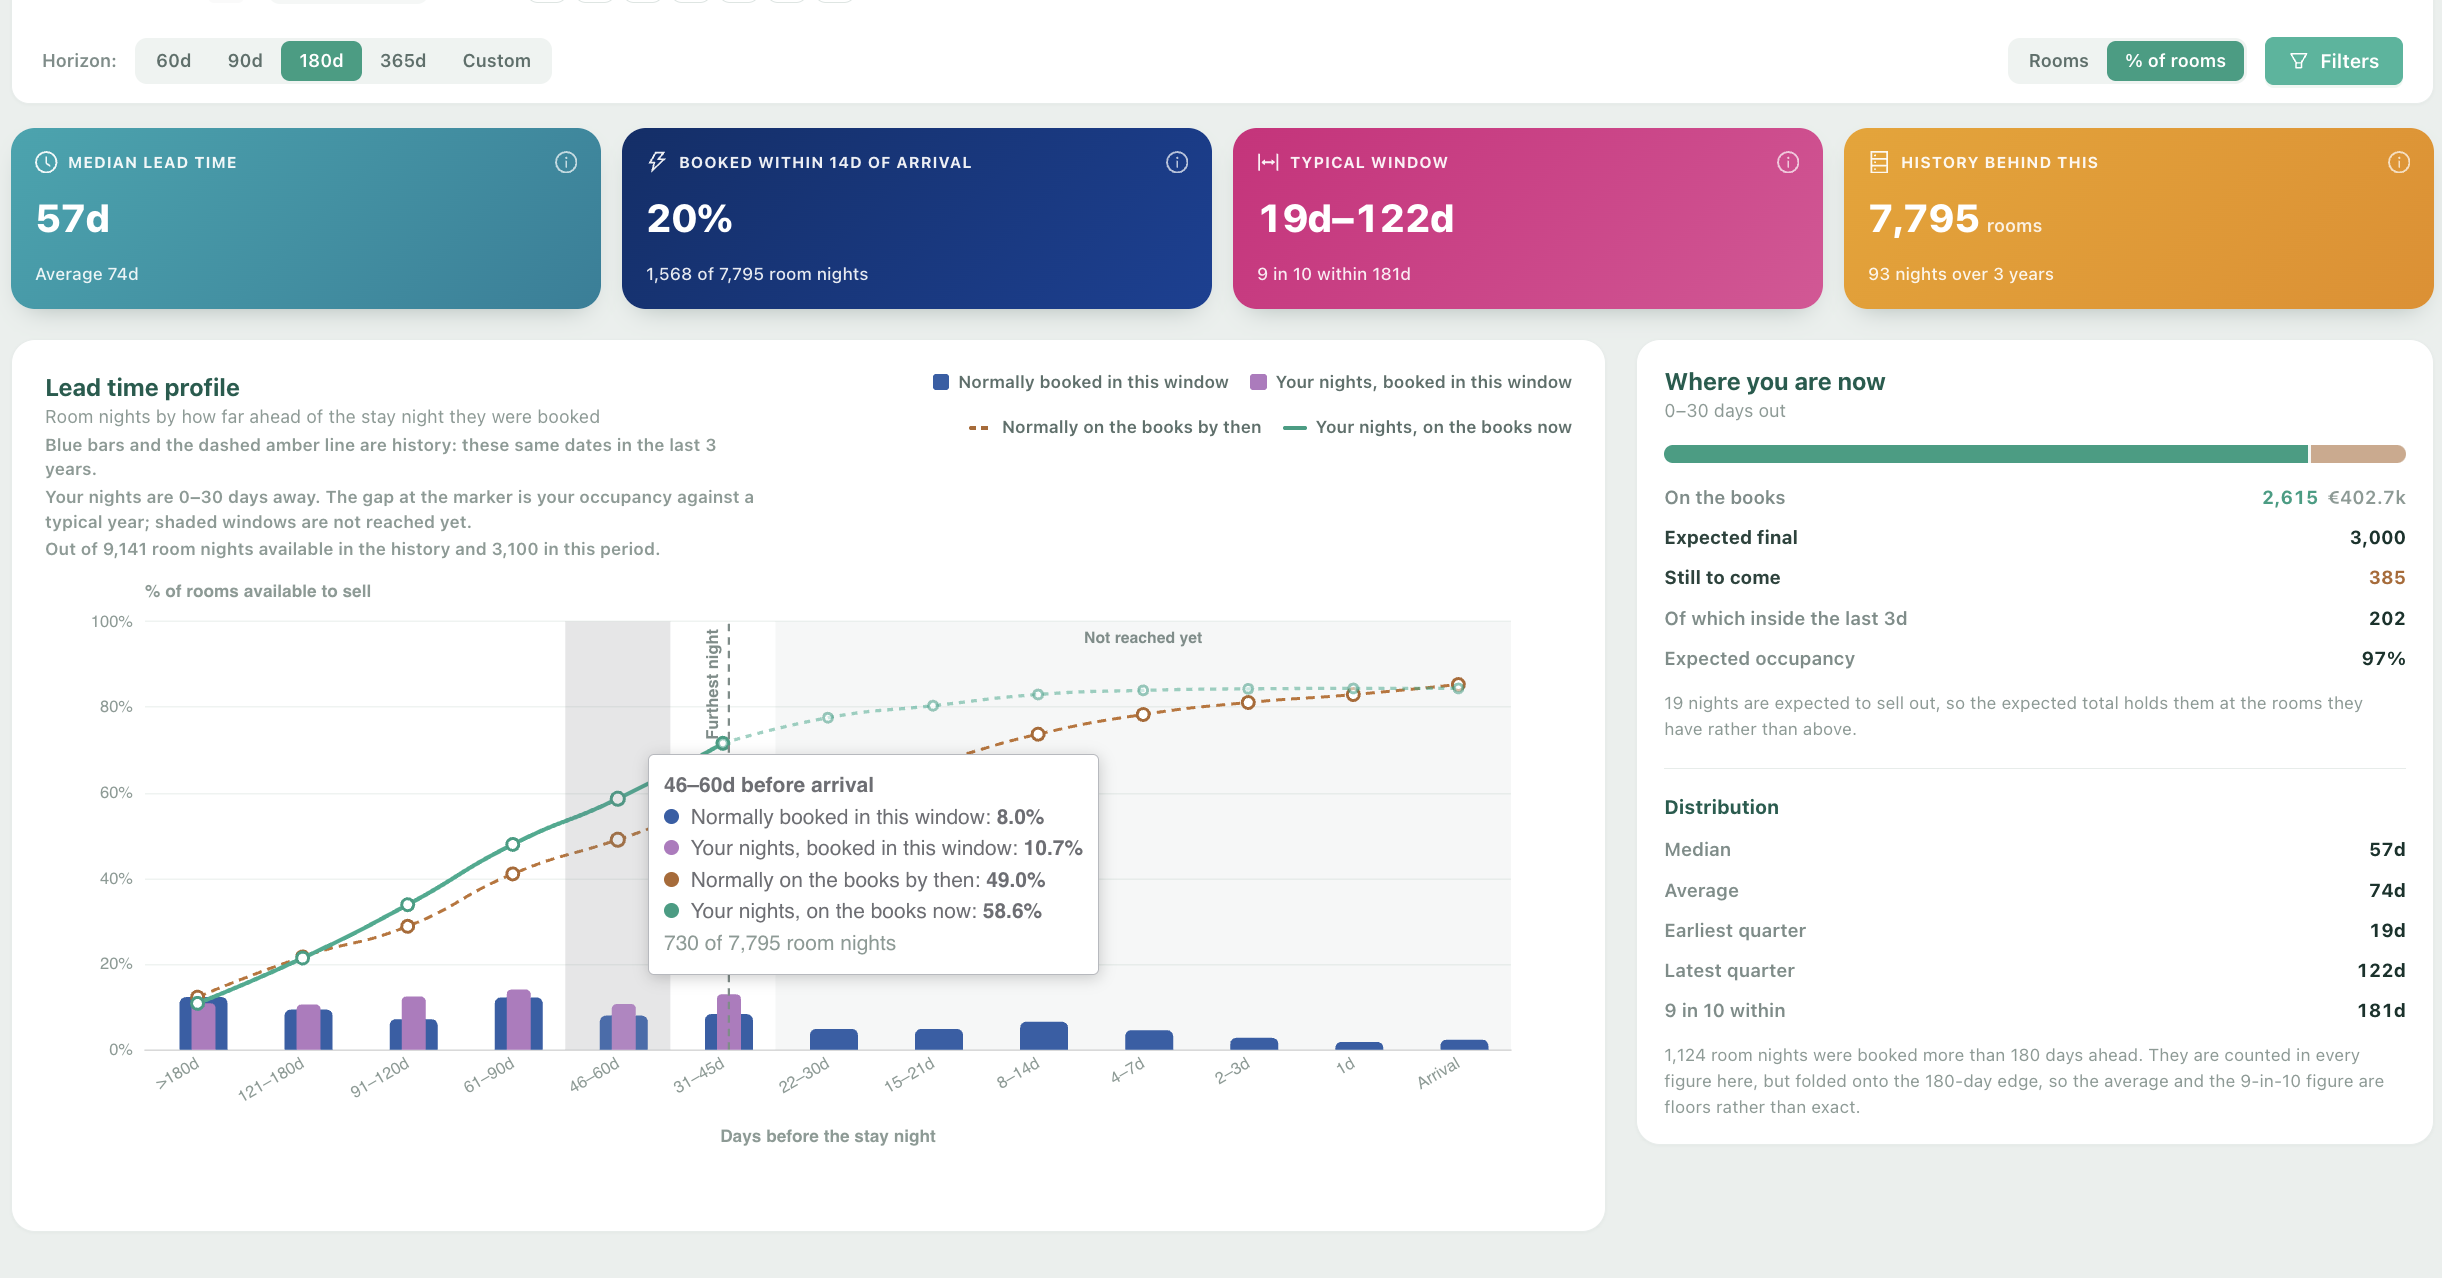
NEW: Lead Time Report
How late is late?
Why we developed it
We hear so much within our industry about shortening booking windows. But is that actually happening in your hotel? And is it happening across all your segments?
Our new Lead Time Report helps you understand how far in advance your guests are booking, how that behaviour is changing and what impact it might have on your business.
Where to find it : Reports / Analysis / Lead Time
How to use it
Select the periods you wish to review and your chosen lead time threshold.
View your median booking lead time. We use the median rather than the average, as bookings made particularly far in advance can distort the figures.
Switch between actual figures and percentages.
Apply filters, including segment, to explore different booking behaviours.
Choose how many years of historical data you wish to compare to understand whether your booking window has changed over time.
What we think you'll love
Every graph and widget is supported by natural-language insights, ensuring we're not just giving you the numbers but helping you understand the 'why' behind them.
So, are your guests really booking later? Now you have the data to find out!
User Experience Upgrades
We've made a number of improvements to make Right Revenue even easier to use, many of which have come directly from your feedback.
Improved Segmentation Report
For those of you who have been with us for a while, you'll know this was one of the older parts of our system. We were desperate to give it a refresh, and here it is!
Where to find it: Reports / Analysis / Segmentation or Snapshot / Yearly and Monthly.
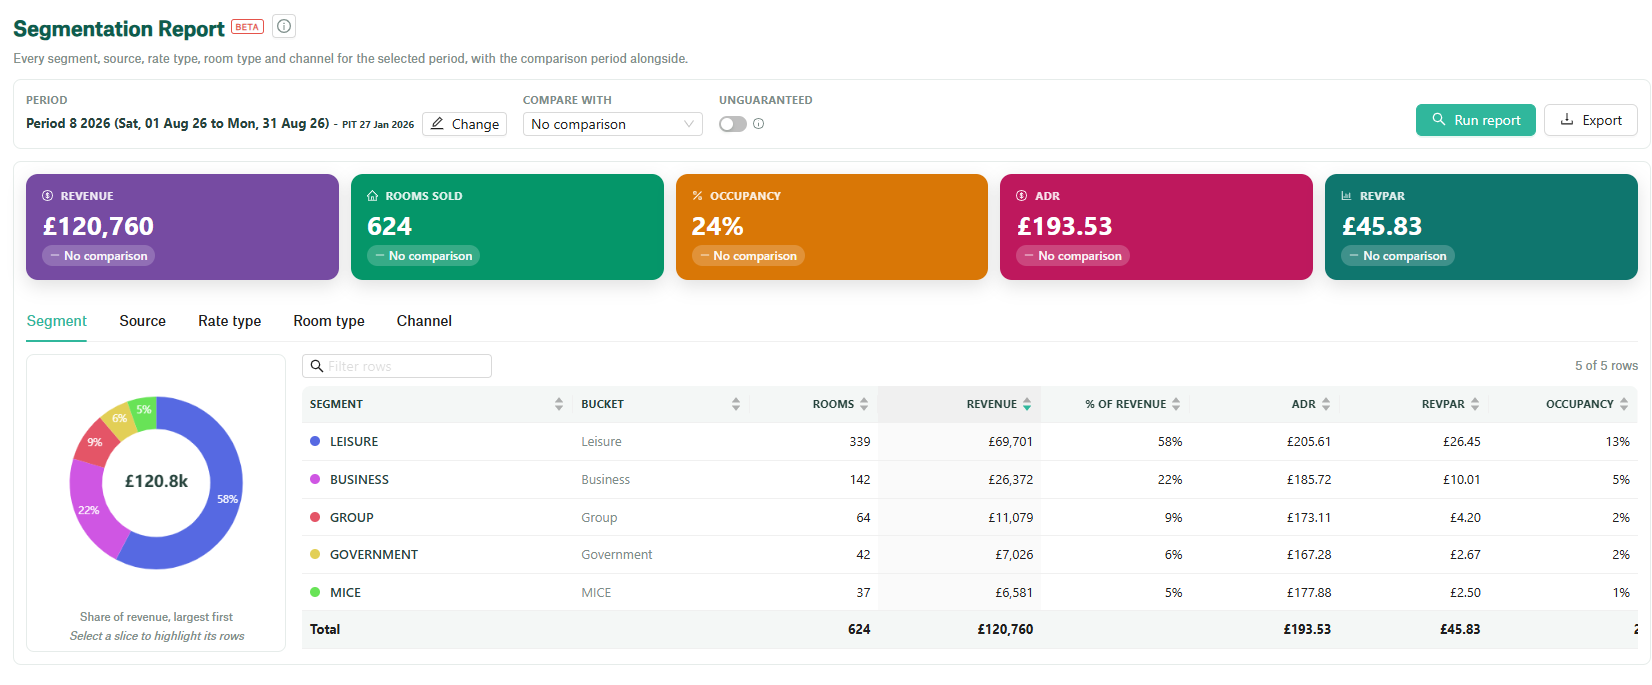
What's changed:
Previously, the toolbar on the right-hand side of your Snapshot displayed only your top three segments. We've listened to your feedback and added a 'View Full Breakdown' option.
This takes you directly to our refreshed Segmentation Report, where you can adjust your dates and KPIs and view a full breakdown of your business and how it is pacing.
We love this report as it gives you all the relevant information at a glance, including where you are pacing ahead and behind, helping you make strategic decisions quickly.
Demand Calendar to Rate Calendar
A little ease-of-use upgrade, again requested by our hotel partners!
What's changed:
If you are viewing your Demand Calendar and wish to adjust your rates or settings based on the information displayed, simply click the new 'Open Rate Calendar' button on the right-hand side of the page.
This takes you directly to your Rate Calendar, where you can adjust your strategy.
And don't forget, you can customise the information displayed on your Demand Calendar using the green widget on the right-hand side of the page.
Fiscal Periods
What's changed:
For those of you who work with fiscal periods, we've now given you the ability to add these yourselves within Right Revenue.
What you need to do: Please ask your Customer Success Manager to activate this functionality for you.
Overview / Business Status
Another upgrade requested by our hotel partners, giving you even more information at a glance.
What's changed:
ADR and occupancy are now displayed as standard within your Business Status widget. You can also add a two-year comparison by clicking the settings cog at the top right of the widget.
As always, we’d love to hear what you think! If any of these new features have caught your eye and you’d like to chat through how to make the most of them, just drop us a line at customersuccess@rightrevenue.co.uk. That’s what we’re here for!
